Hello, and happy Friday! Hope you had a good week full of progress. Though my week started off choppy, I felt like I accomplished a lot this week.
After building a surplus of content at the end of last week…I promptly lost that advantage this week. I took a mental health day on Monday, and didn’t do any writing that day, nor did I do any writing yesterday on Thursday, which puts me in a situation where I’m now writing some extra content this weekend to try to play catch up. Still! Writing four posts a day continues to feel extremely manageable.
A whole lot of app updates
Most of my focus this week has been on the sticker chart app. I am trying to get it production-ready as quickly as possible so I can hopefully start some marketing on it in the next couple of weeks and maybe start getting some users.
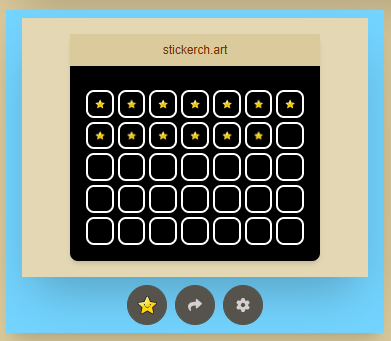
I started the week still working on the preview controls for the logged-in user’s charts. The user can see a preview of all their charts from a dashboard-like page, along with a few controls for performing different actions on the charts.
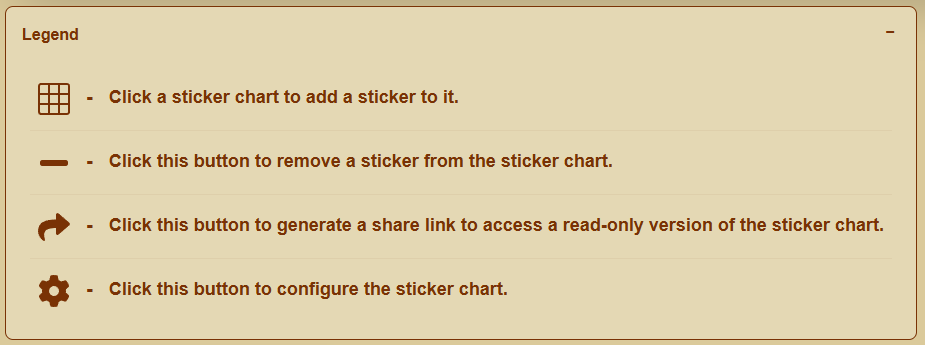
I also added a legend to this page, explaining the different actions that the user can take with this control.
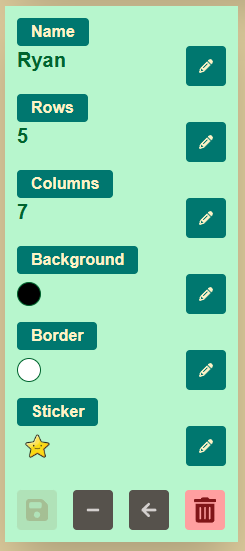
The chart configuration control also saw a ton of updates this week. Functionally it’s mostly the same, but I did do a lot of touches to the look & feel to the editor toolbar and its buttons, as well as the various dialogs and buttons in use elsewhere on this page. The result is a more consistent look across the entire app, instead of a mixture of different shapes in use for the controls.
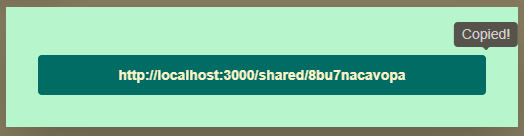
There is also now the ability to generate a shareable link for a chart. Clicking the share button generates the link, which is then displayed in a dialog from which it can be easily copied. The purpose of this is to be able to send a read-only version of the chart to your kid, or maybe even to put on a tablet somewhere in your house, so you can display the sticker chart without worrying about someone adding stickers to it when they shouldn’t.
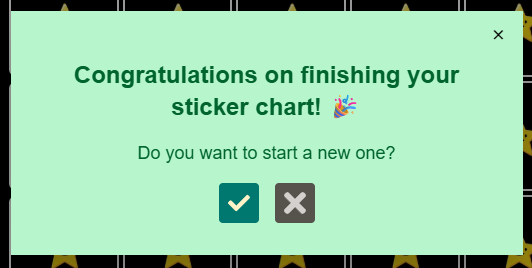
I have now also implemented the chart completion flow. When a user completely fills a chart with stickers, a dialog now appears asking the user whether or not they’d like to start the chart over.
Initially my approach was to insert a whole new sticker chart that was linked to the previously created chart, retiring the old chart from the UI and replacing it with the fresh one. The purpose of this was originally to be able to see a history of all the sticker charts that had been completed. However, from a database standpoint this starts to become expensive the more users get added to the app. So, I decided to refactor, resetting the stickerCount on the chart record to 0 and incrementing a timesCompleted counter. I’m not sure anyone will find any value in keeping all those database records around, but I can always pivot back in the future if that becomes the case.
At this point all I have left to build into this app is the paywalling. Originally I had intended on doing a 7-day free trial and then charging $2-$3/month for access. However, I read some stuff recently about trying out weekly subscriptions, and so I’ve decided to try that route instead. I’ll be doing away with the free trial entirely, still leaving the free chart access for users, and offering a $0.99/week subscription to access the full app. I think this reduces the commitment users need to make to the app, and makes the pricing look even more appealing. We’ll see how it works!
I have a pretty good example of how to do the Stripe integration, so even though I’ve never done it before, I feel pretty confident it will come together quickly. Right now I’d really like to have the app completely done and ready to market by the end of next week. It would be amazing to be able to go into June having made some money from at least one app.
Anyway that’s basically it for this week! I definitely got a little heads-down coding, and wasn’t as focused on the other aspects of my business as I should have been, but I am really eager to get this app out. We’ll see how it goes! I’ll update you again next week!